The head and shoulders chart pattern is a reversal pattern and most often seen in uptrends.
Not only is “head and shoulders” known for trend reversals, but it’s also known for dandruff reversals as well. 😂
In this lesson, we’ll stick to talking about trend reversals and leave the topic of dandruff for another time.
Head and Shoulders
A head and shoulders pattern is also a trend reversal formation.
It is formed by a peak (shoulder), followed by a higher peak (head), and then another lower peak (shoulder).
A “neckline” is drawn by connecting the lowest points of the two troughs.
The slope of this line can either be up or down. Typically, when the slope is down, it produces a more reliable signal.
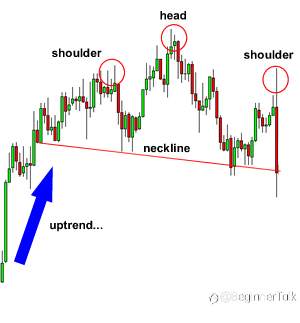
In this example, we can easily see the head and shoulders pattern.
The head is the second peak and is the highest point in the pattern. The two shoulders also form peaks but do not exceed the height of the head.
With this formation, we put an entry order below the neckline.
We can also calculate a target by measuring the high point of the head to the neckline.
This distance is approximately how far the price will move after it breaks the neckline.
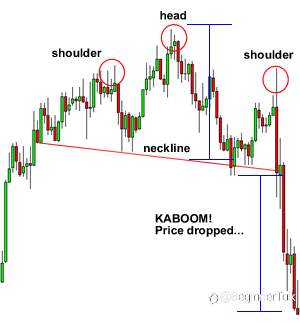
You can see that once the price goes below the neckline it makes a move that is at least the size of the distance between the head and the neckline.
We know you’re thinking to yourself, “the price kept moving even after it reached the target.”
And our response is, “DON’T BE GREEDY!”
Inverse Head and Shoulders
The name speaks for itself. It is basically a head and shoulders formation, except this time it’s upside down. 🙃
A valley is formed (shoulder), followed by an even lower valley (head), and then another higher valley (shoulder).
These formations occur after extended downward movements.
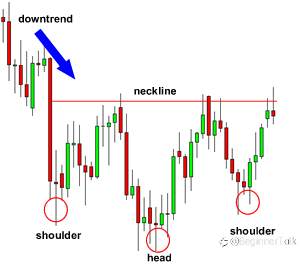
Here you can see that this is just like a head and shoulders pattern, but it’s flipped upside down.
With this formation, we would place a long entry order above the neckline.
Our target is calculated just like the head and shoulders pattern.
Measure the distance between the head and the neckline, and that is approximately the distance that the price will move after it breaks the neckline.
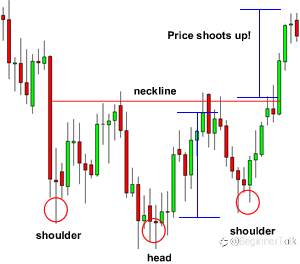
You can see that the price moved up nicely after it broke the neckline.
If your target is hit, then be happy with your profits.
However, there are trade management techniques where you can lock in some of your profits and still keep your trade open in case the price continues to move your way.
You will learn about those later on in the course.
Reprinted from Babypips,the copyright all reserved by the original author.
편집됨
면책 조항: 본 게시글에 표현된 견해는 전적으로 작성자의 견해이며 Followme의 공식 입장을 대변하지 않습니다. Followme는 제공된 정보의 정확성, 완전성 또는 신뢰성에 대해 책임을 지지 않으며, 서면으로 명시적으로 언급되지 않는 한 해당 내용을 기반으로 취해진 어떠한 조치에 대해서도 책임을 지지 않습니다.

더 오래된 의견은 없습니다. 소파를 가장 먼저 잡으십시오.