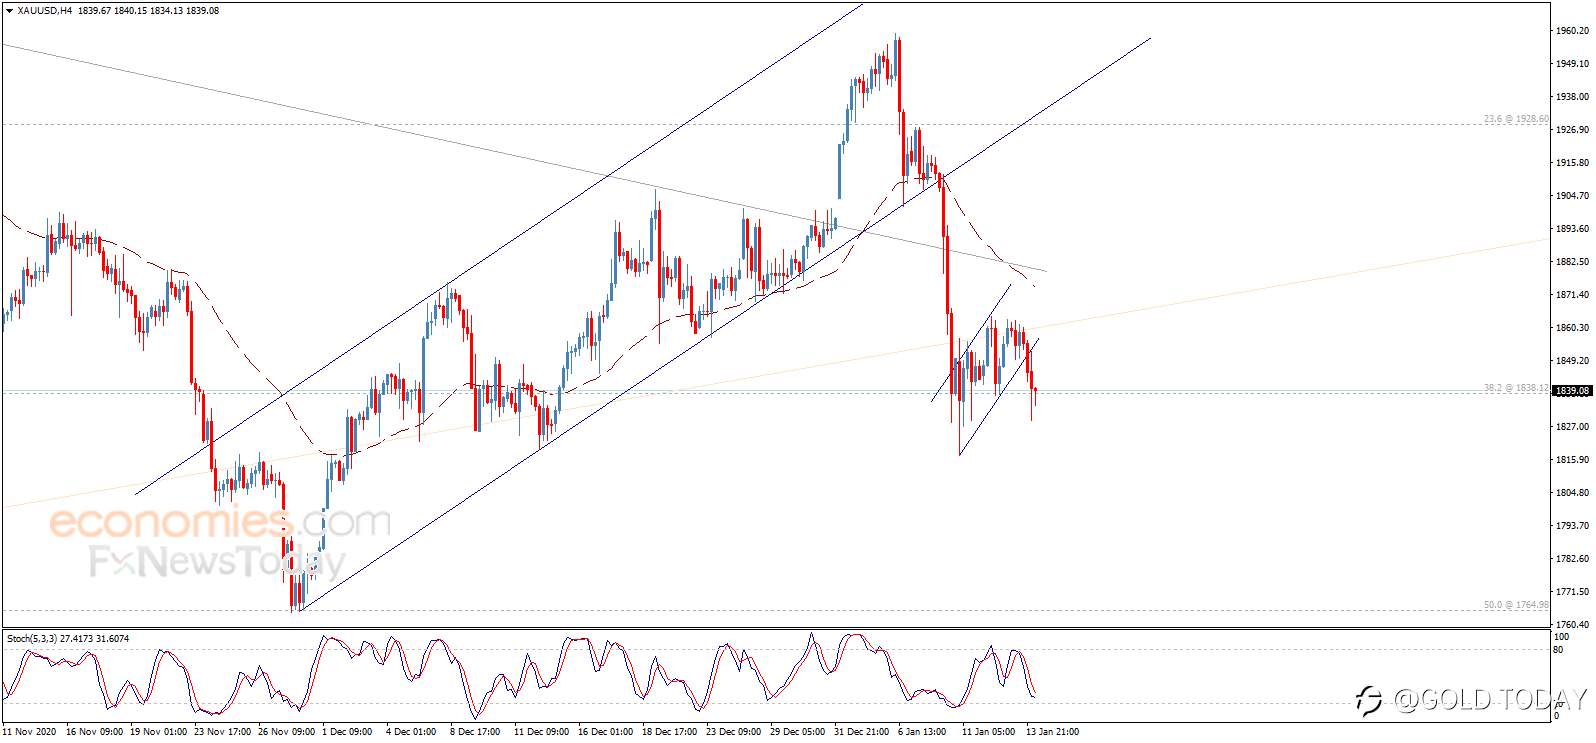
Illustration photo of Gold Price H4 Chart from economies.com
Yesterday, gold prices faced negative pressure to break the support line of the minor bullish channel that appears on the chart. This forms a bearish flag pattern that pushes the price to achieve more decline now, as the price begins today with additional bearish bias to attack $1838.10. Expect to see more decline in the coming sessions, targeting $1800 on the near-term basis.
The 50-day exponential moving average (EMA50) supports the proposed bearish bias and will remain valid unless the price rallied to break the $1855.70 mark.
Trading range for today is expected to be between $1815 support and $1855 resistance.
Meanwhile, today’s trend is expected to be bearish.
FOLLOWME XAU/USD Overall Sentiment (As of 5:18 p.m., Jan 14, 2021)
Short - 50.00%
Long - 50.00%
Source: economies.com
면책 조항: 본 게시글에 표현된 견해는 전적으로 작성자의 견해이며 Followme의 공식 입장을 대변하지 않습니다. Followme는 제공된 정보의 정확성, 완전성 또는 신뢰성에 대해 책임을 지지 않으며, 서면으로 명시적으로 언급되지 않는 한 해당 내용을 기반으로 취해진 어떠한 조치에 대해서도 책임을 지지 않습니다.

- 끝 -