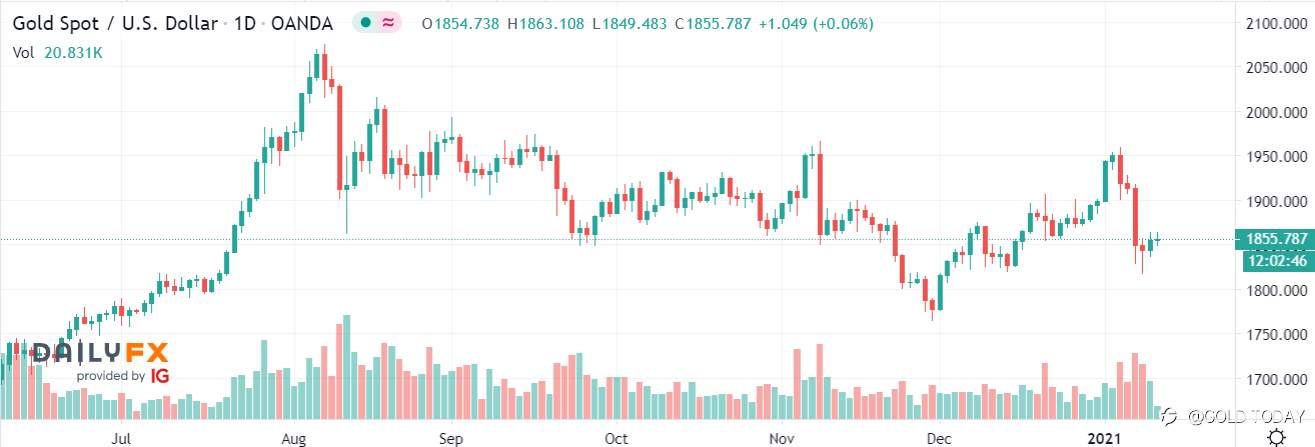
Illustration photo of Gold Price H4 Chart from dailyfx.com
Gold prices are relishing some relief after falling from the posted two-month high of around $1960 last week, or 7%. Spot gold sees a 0.6% advance and the slight recovery is less than 2%.
From a technical point of view, Bullion’s 200-day Simple Moving Average (SMA) is playing its role as a key support level. The precious metal has been consistently trading above its 200-SMA since the end of 2018, and there were only two short-lived dips below the line over the past 12 months.
Gold’s pullback that began last week could be a healthy move from a technical point of view as the metal’s 14-day relative strength index had hit the 70 mark.
Spot prices may still have to clear November’s high of $1965.46 to further encourage gold bulls.
Meanwhile, gold has an interesting relationship with the greenback as the yellow metal is priced in U.S. dollars. In other words, when the dollar goes up, gold prices go down.
Note that gold has an inverse relationship with the dollar, given the precious metal is priced in USD. In simpler terms, when the dollar goes down, gold prices tend to go up, and vice versa.
There is a consensus that gold prices may rise as the dollar grows weaker in the coming months. This is due to the expected overshoot in inflation by the Federal Reserve (Fed) and U.S. Treasury’s yields are in the negative direction. Also of note that will affect gold prices would be President-elect Biden’s fiscal stimulus plans, which will be unveiled on Thursday.
FOLLOWME XAU/USD Overall Sentiment (As of 6:02 p.m., Jan 13, 2021)
Short - 50.52%
Long - 49.48%
Source: fxempire.com
면책 조항: 본 게시글에 표현된 견해는 전적으로 작성자의 견해이며 Followme의 공식 입장을 대변하지 않습니다. Followme는 제공된 정보의 정확성, 완전성 또는 신뢰성에 대해 책임을 지지 않으며, 서면으로 명시적으로 언급되지 않는 한 해당 내용을 기반으로 취해진 어떠한 조치에 대해서도 책임을 지지 않습니다.

- 끝 -