Illustration photo of Gold Price H4 Chart from fxempire.com
On Friday, gold prices plummeted $66 for the first time since December 2020, below its 200-day moving average. After trading to a low $1828, gold futures closed a low $1836, four dollars below its 200-day moving average.
Today, gold open at $1849, merely $9 above the 200-day moving average and in the evening session traded to an intraday low of $1817 before recovering.
Gold’s most active February 2021Comex is currently fixed at $1847, up by $11.60. Market participants have re-focused their attention to the precious metal after a lower composite trading by all three of the major indices - the Dow, the NASDAQ, and the S&P 500, while Bitcoin also faces a strong sell-off.
The price increase on the yellow metal today has managed to overcome the greenback’s strength. While the dollar is fixed at 90.485, up +0/48%, gold futures are currently trading up +0.63%. A neutral dollar would have seen gold gaining 1.11%.
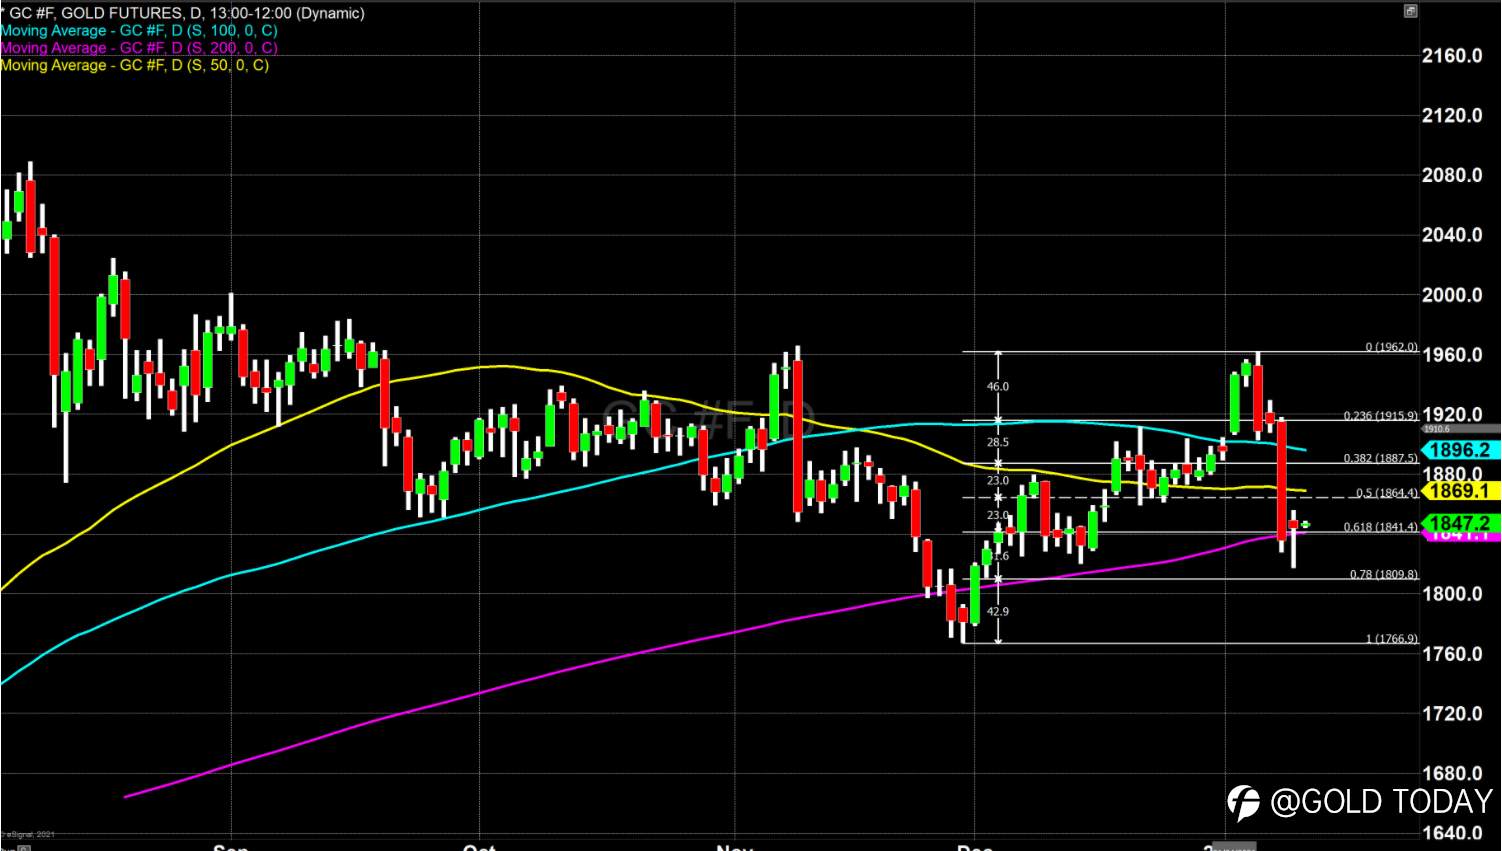
On the technical side, the lowest level of support occurs at 50% retracement, currently fixed at $1768.60 and above that is the 200-day moving average fixed at $1840 currently. That is just above the 38.2% Fibonacci retracement level, a data set beginning in March when gold traded at $1400 to the all-time record high of $2088 in August 2020. While the current pricing of the precious metal is close to levels of support, the first resistance is the current 50-day moving average, occurring at $1869.
FOLLOWME XAU/USD Overall Sentiment (As of 6:29 p.m., Jan 12, 2021)
Short - 50.31%
Long - 49.69%
Source: fxempire.com
면책 조항: 본 게시글에 표현된 견해는 전적으로 작성자의 견해이며 Followme의 공식 입장을 대변하지 않습니다. Followme는 제공된 정보의 정확성, 완전성 또는 신뢰성에 대해 책임을 지지 않으며, 서면으로 명시적으로 언급되지 않는 한 해당 내용을 기반으로 취해진 어떠한 조치에 대해서도 책임을 지지 않습니다.

더 오래된 의견은 없습니다. 소파를 가장 먼저 잡으십시오.