The EUR/USD is building a correction with lower highs and higher lows. Price action seems to be in a bearish ABC pattern within a bullish wave B. What are the key levels to consider?
Price Charts and Technical Analysis
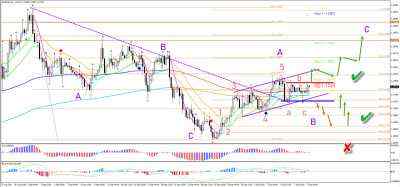
The EUR/USD support (blue line) and resistance (red line) levels are key for determining the next price swing. A bullish breakout above the resistance indicates a completed bearish ABC (red) within wave B (purple) and a continuation higher within the wave C (purple). The targets are the Fibonacci levels although the main Fib target is confluence of the -61.8% Fib and 78.6% Fib at 1.1925. A bearish breakout indicates a downside move towards the Fibonacci retracement levels of wave B (purple). This remains valid as long as price remains above the 100% Fibonacci level.The EUR/USD 1 hour chart is showing the current indecisiveness well. A bullish breakout above the resistance (red box) confirms a completed ABC (red). But a bearish breakout below the support (blue box) indicates that the waves B and C will shift forward (red arrows). The bulls are expected to keep control, either after the breakout or after a bounce at the Fibonacci retracement levels.

Reprinted from Fxempire,the copyright all reserved by the original author.
면책 조항: 본 게시글에 표현된 견해는 전적으로 작성자의 견해이며 Followme의 공식 입장을 대변하지 않습니다. Followme는 제공된 정보의 정확성, 완전성 또는 신뢰성에 대해 책임을 지지 않으며, 서면으로 명시적으로 언급되지 않는 한 해당 내용을 기반으로 취해진 어떠한 조치에 대해서도 책임을 지지 않습니다.

더 오래된 의견은 없습니다. 소파를 가장 먼저 잡으십시오.