GOLD PRICE CLEARS 1800 HURDLE FROM 2011/12
Gold has been making good on the consolidation pattern around the 1800 level discussed last week. The breakout is putting some distance between the price of gold and the 2011/12 triple peaks that were holding the yellow metal back. We may see some a dip, but old resistance is now viewed as new support.
We can continue to use the trend-line from the March low and channel structure from early June as a guide for tracking the bullish bias higher. Stay above the lower line of the channel/trend-line and a bullish outlook stays intact.
A drop below the trend-line won’t necessarily turn the outlook bearish, but hint at the likelihood of a larger pullback towards the important 1800/1790-area that is former resistance turned support. On the top-side there isn’t much keeping gold from trading to the 2011 spike-high at 1920.
GOLD PRICE DAILY CHART (BULLISH CHANNEL)

Gold Price Chart by TradingView
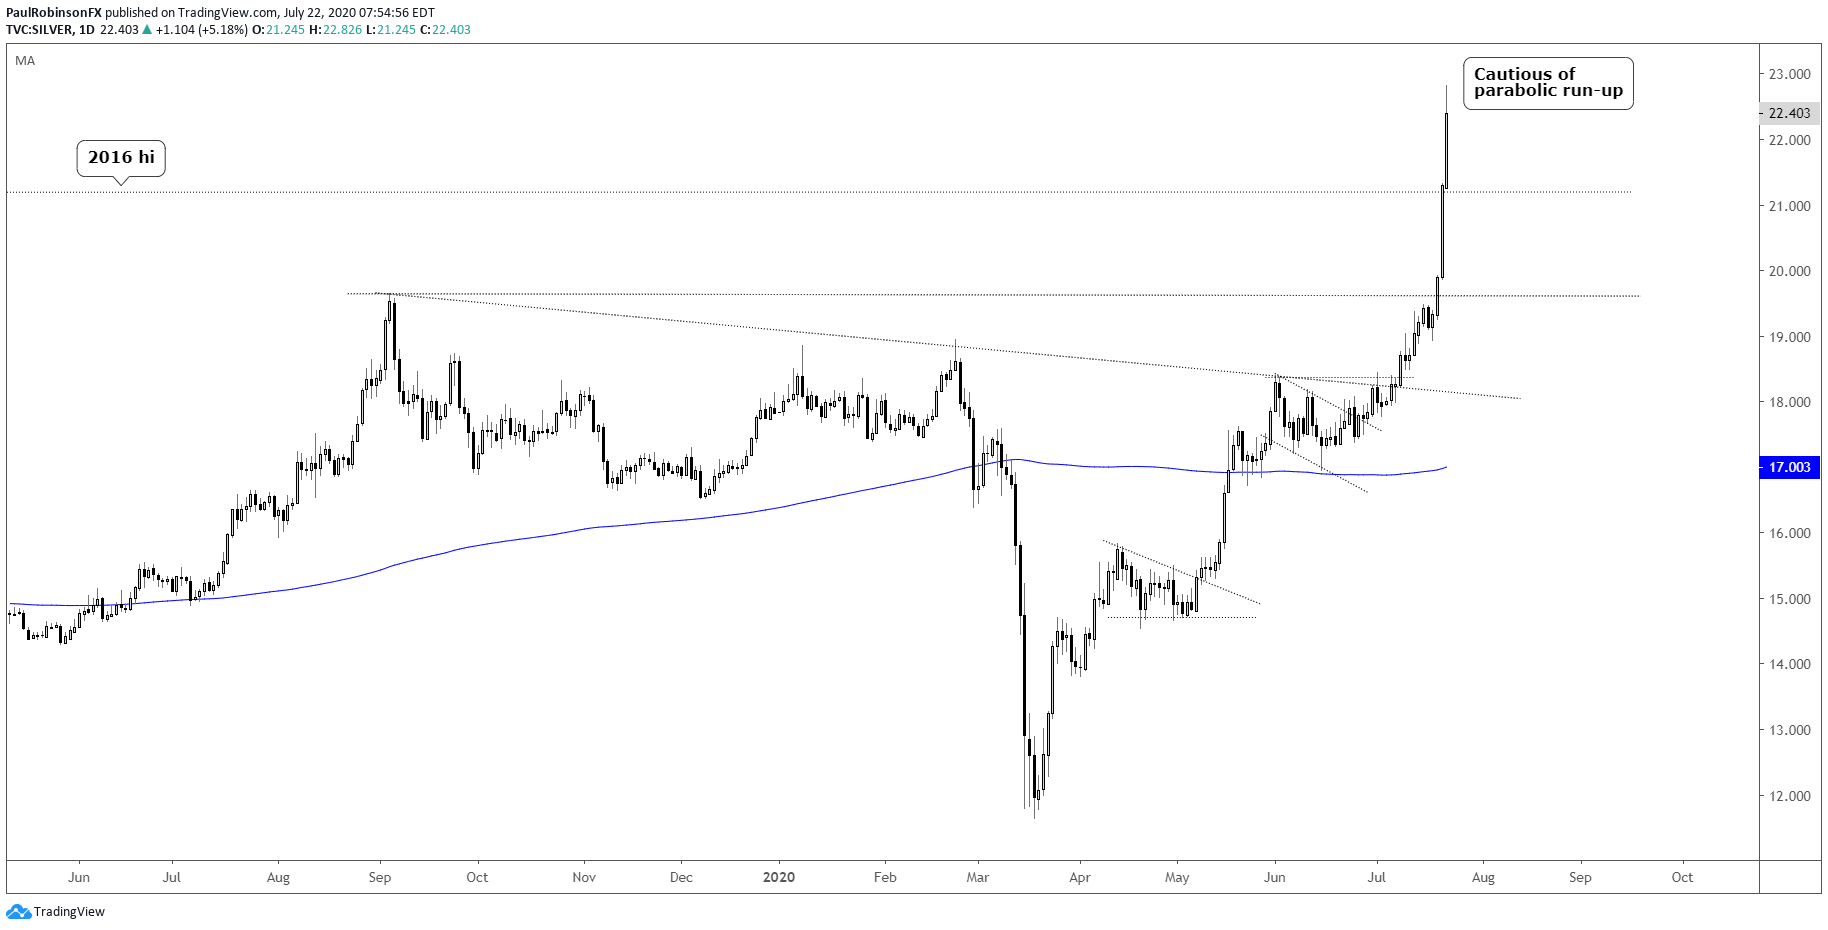
SILVER SPIKES ABOVE 2016 HIGH, SHOWINGS SIGNS OF BLOW-OFF
Silver has been running wild since yesterday, with it at the overnight high tacking on a 14% gain since the since the Monday close. This came after breaking out above the 2019 high to start the week. The move has silver at the highest its been since 2013, which generally bodes well for the precious metal.
However, traders may want to take a cautious stance here as a large squeeze occurring near the end of what has been almost a 100% run off the March low suggests an exhaustion point may be very near. If this is the case, silver will likely at the least take a breather via a sideways move, if not correct lower a bit to work off overbought conditions.
SILVER DAILY CHART (SPIKING TO 2013 LEVELS)
https://www.dailyfx.com/forex/...
면책 조항: 본 게시글에 표현된 견해는 전적으로 작성자의 견해이며 Followme의 공식 입장을 대변하지 않습니다. Followme는 제공된 정보의 정확성, 완전성 또는 신뢰성에 대해 책임을 지지 않으며, 서면으로 명시적으로 언급되지 않는 한 해당 내용을 기반으로 취해진 어떠한 조치에 대해서도 책임을 지지 않습니다.

더 오래된 의견은 없습니다. 소파를 가장 먼저 잡으십시오.