USD/CAD PRICE – REVERSED HIGHER
On Thursday, USD/CAD declined to an over two-week low at 1.3491. However, the price rallied after and closed the weekly candlestick on Friday in the green with a 0.3% gain. Alongside that, the Relative Strength Index (RSI) rose from 42 to 48 and reflected a weaker bearish momentum.
Safe havens rallied over fears that the coronavirus resurgence in the US may cause new restrictions and slow down the economic recovery. Investors await for Bank of Canada meeting tomorrow, yet the worst of the Covid-19-induced GDP contraction might be over therefore, the bank may keep its policy unchanged.
USD/CAD DAILY PRICE CHART ( AUG 2, 2018 – JULY 14, 2020) ZOOMED OUT

USD/CAD DAILY PRICE CHART (APRIL 22 – JULY 14, 2020) ZOOMED IN

In Mid-June, USD/CAD corrected its downside move and started a sideways move. Since then, the price has failed on multiple occasions to move to the lower trading zone and highlighted weaker bears at that point. On Thursday, the market reversed higher and eyed the high end of the current trading zone 1.3511- 1.3793.
A close above the high end of the zone signals that bulls may push USDCAD towards 1.4000 and a further close above that level could encourage them to extend the rally towards 1.4320.
On the other hand, a close below the low end of the zone signals that USDCAD could fall towards 1.3291, and any further close below that level may embolden bears to press the market even lower towards 1.3015
USD/CAD FOUR HOUR PRICE CHART (MAY 29 – JULY 14, 2020)
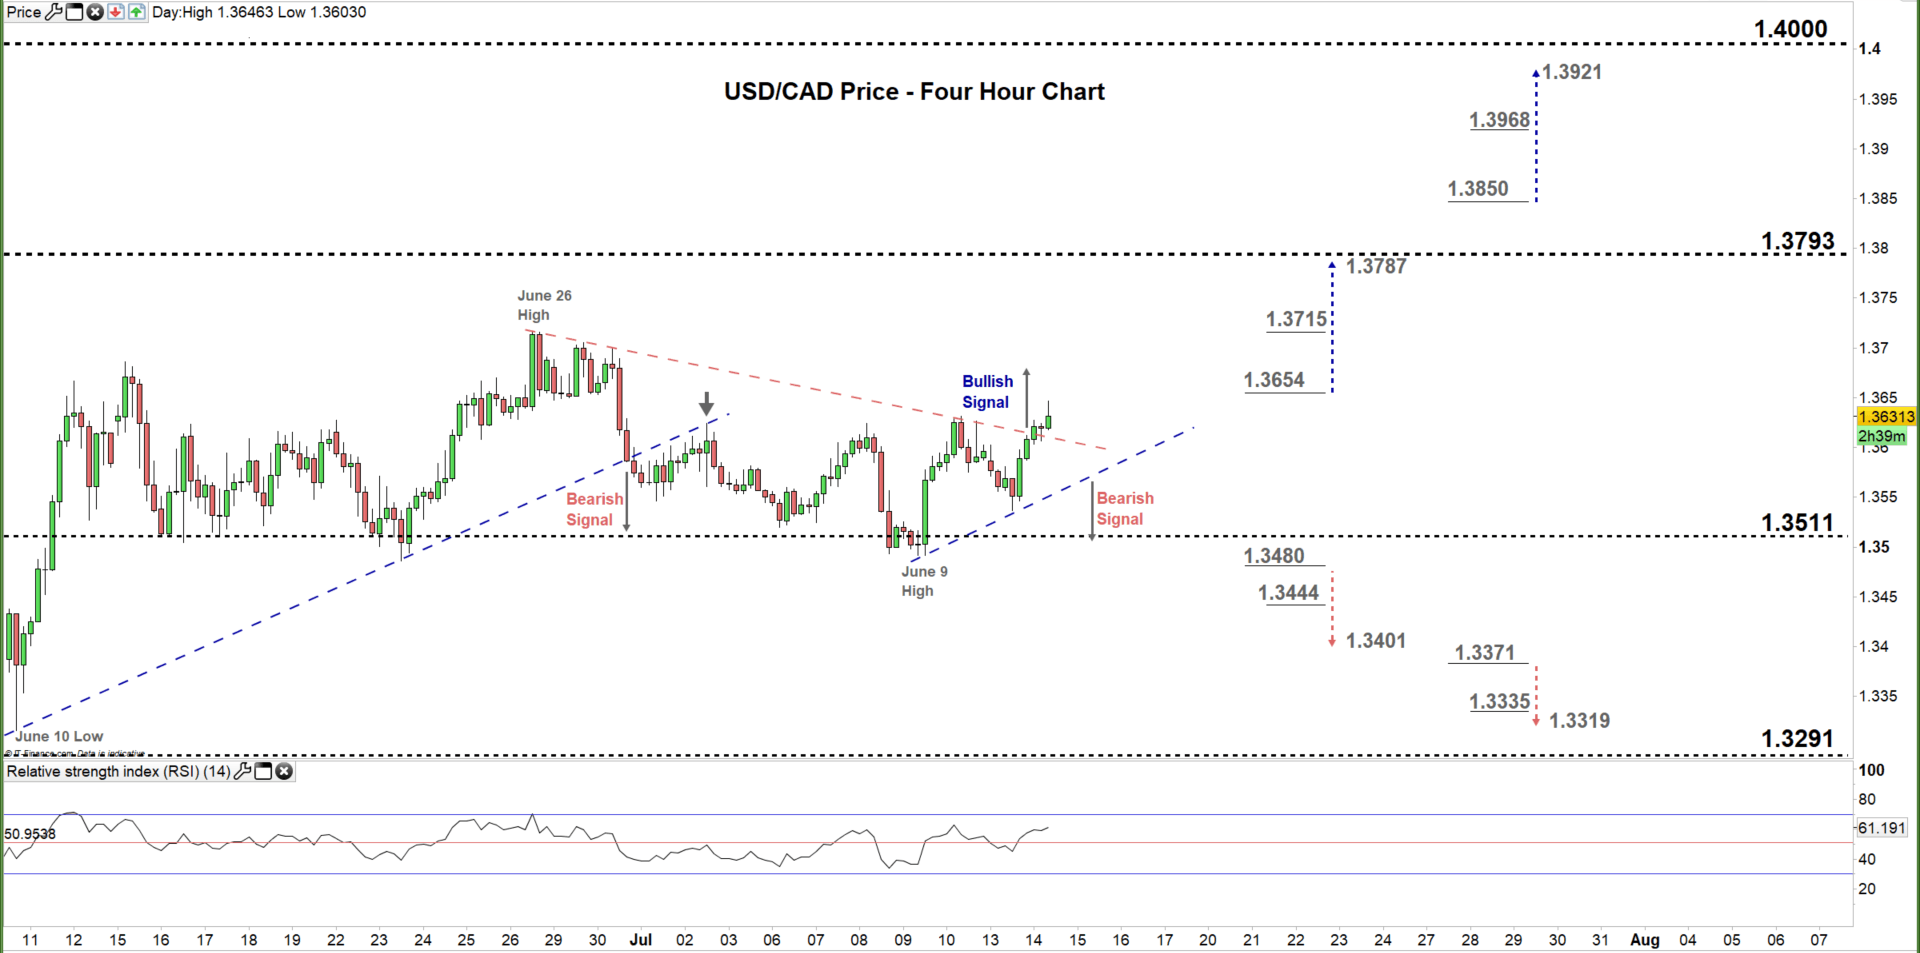
By the end of June, USD/CAD traded below the uptrend line originated from the June 10 low at 1.3315 and indicated bear’s attempt to control the price action.
Today, the pair has broken above the downtrend line originated from the June 26 high at 1.3715, and generated a bullish signal. With that said, any break below the uptrend line originated from the June 9 low at 1.3491 could reverse lower the market direction.
To conclude, a break above 1.3654 may trigger a rally towards 1.3787, while a break below 1.3480 could send USDCAD towards 1.3401. Nonetheless, the weekly support and resistance levels underscored on the four-hour chart should be watched closely.
Written By: Mahmoud Alkudsi, Market Analyst
https://www.dailyfx.com/forex/...
면책 조항: 본 게시글에 표현된 견해는 전적으로 작성자의 견해이며 Followme의 공식 입장을 대변하지 않습니다. Followme는 제공된 정보의 정확성, 완전성 또는 신뢰성에 대해 책임을 지지 않으며, 서면으로 명시적으로 언급되지 않는 한 해당 내용을 기반으로 취해진 어떠한 조치에 대해서도 책임을 지지 않습니다.

더 오래된 의견은 없습니다. 소파를 가장 먼저 잡으십시오.