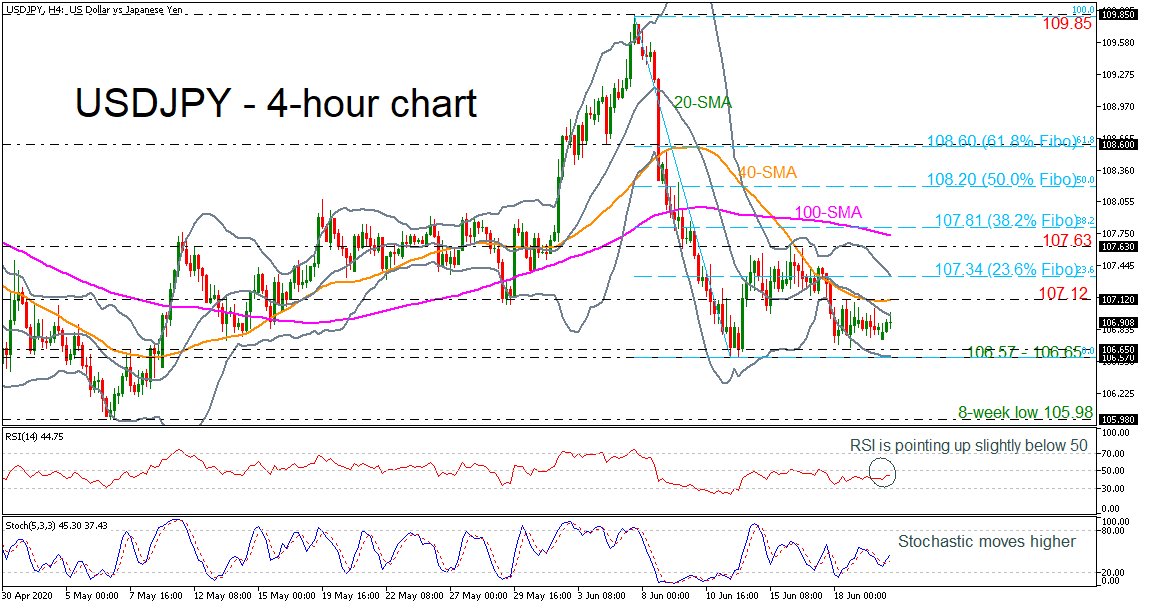
USDJPY has been underperforming in the past few days, flirting with the mid-level of the Bollinger band, hovering around the 107.00 psychological mark. When looking at the last two weeks, the pair lacks a clear trend and has been consolidating after its bearish run from 109.85 stalled at 106.57.
On the 4-hour chart, the RSI indicator is moving north in the negative territory, while the %K line of the stochastic oscillator created a bullish crossover with the %D line. The Bollinger Band is titled to the downside at the moment, suggesting more losses.
If price action jumps above the 107.12 resistance, which coincides with the 40-period simple moving average (SMA), there is scope to test the upper Bollinger band and the 23.6% Fibonacci retracement level of the down leg from 109.85 to 106.57 at 107.34. Rising above it would see prices re-test the 107.63 barrier and then the 100-period SMA at 107.73. Marginally above this line, the 38.2% Fibo of 107.81 could be a significant signal for an upside rally towards the 50.0% Fibo of 108.20.
Alternatively, if the 106.57 – 106.65 support area fails then the focus would shift to the downside towards the eight-week low of 105.98. Breaching this obstacle, would increase speculation for more downside pressure towards the 105.20 support, taken from the low on March 16.
Overall, USDJPY has been bearish-to-neutral in the short-term timeframe since peaking at 109.85. Near-term weakness is expected to remain as long as price action takes place below the mid-level of the Bollinger band.
Reprinted from actionforex, the copyright all reserved by the original author. #howtomasterforextrading##USD/JPY#
면책 조항: 본 게시글에 표현된 견해는 전적으로 작성자의 견해이며 Followme의 공식 입장을 대변하지 않습니다. Followme는 제공된 정보의 정확성, 완전성 또는 신뢰성에 대해 책임을 지지 않으며, 서면으로 명시적으로 언급되지 않는 한 해당 내용을 기반으로 취해진 어떠한 조치에 대해서도 책임을 지지 않습니다.

더 오래된 의견은 없습니다. 소파를 가장 먼저 잡으십시오.